Best APM tools in 2019
It’s one thing to manage IT infrastructure and networks, but often it’s the applications that require the most attention. It’s not just that there can be so many of them, but also the fact they tend to update frequently which can cause problems with software conflicts and unexpected issues with hardware.
This is where application performance management (APM) software tools can really reduce the IT management burden, by providing a single platform to manage all apps rather than having to manage and troubleshoot each one individually.
This means a single dashboard from which you can manage updates, watch for conflicts, and deal with any faults or errors that may arise because of app events, data, or resource use. It also means you can get an overall view of performance making it easy and quick to not just identify any problems with apps resolve any such issues.
We’ve therefore looked at the best in APM tools, where the software can be used not just for monitoring but also for general optimization as part of an overall IT strategy.
Also Read: Best small business servers of 2019
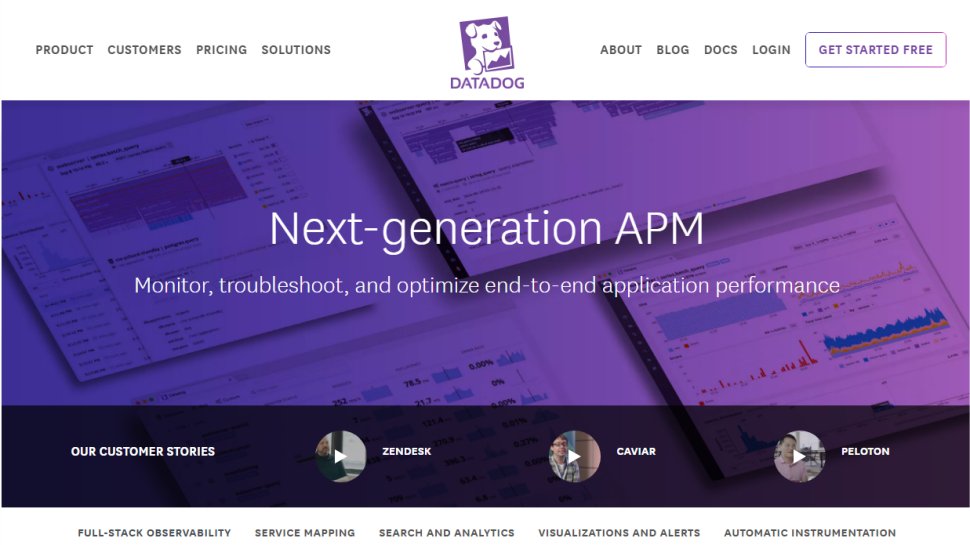
Datadog APM is a SaaS-based platform for monitoring, troubleshooting, and optimizing applications. It does this through a number of features, not least by providing full-stack visibility, which allows customers to collect, search, and analyze traces across their full infrastructure, whether cloud-based, servers or applications.
This can be done via a global overview which can be drilled down to a specific line of code, using a combination of analytics and software metrics. Real-time interactive dashboards provide the mapping of data services and clusters, with one-click navigation allowing processes to be isolated. These can be customized according to need, such as by using drag-and-drop performance dashboards or automated using APIs, to provide performance alerts.
Datadog’s APM can be deployed on most popular libraries and frameworks with a single command, providing instant monitoring. It also supports the OpenTracing protocols for applications and framework developers for distributed vendor-neutral tracing.
Pricing for the APM with distributed tracing begins at $36 per host per month for up to one million events per host but is discounted to $31 if paid annually. For an extra fee, you can include the trace search and analytics add-on, which costs $1.52 per million APM events if paid monthly but is discounted to $1.27 if paid annually.
Loupe is an effective, feature-packed application performance management tool. Aimed at enterprises and IT administrators, this solution lets you trace events, performance and other metrics to work out the causes of issues affecting software negatively.
A good APM solution will help you find problems with apps straight away, and if you’ve got to hunt through a sprawling list of potential issues, then it’s going to be hard to do that. However, Loupe automatically groups log events so you can find and address performance issues with a minimum of fuss.
The system also gives you a visual understanding of your application usage and offers insights into bottlenecks that can subsequently be tackled. It’s easy to get up and running with this system, as you don’t have to install anything onto your servers – the setup process is very nicely streamlined. Loupe offers a free trial, but no free tier.
Plenty of businesses use the cloud along with on-premise systems, and when you have a bunch of different apps – from the cloud through hybrid to traditional software installations – monitoring them all can be very difficult. Traverse Monitoring is an APM tool that aims to tackle these sort of scenarios.
It can automatically discover apps, networks, servers, and systems, meaning you don’t have to dedicate time in order to configure things manually. Once it’s set up and running, Traverse will monitor each device and app to determine if there are any issues, including on-premise, cloud, and hybrid technology. If a problem is identified, it’ll fire up a troubleshooting process and try to resolve it before your business is affected.
You can also back up and restore changes across your applications, and you’re sent predictive analytics concerning their overall performance.
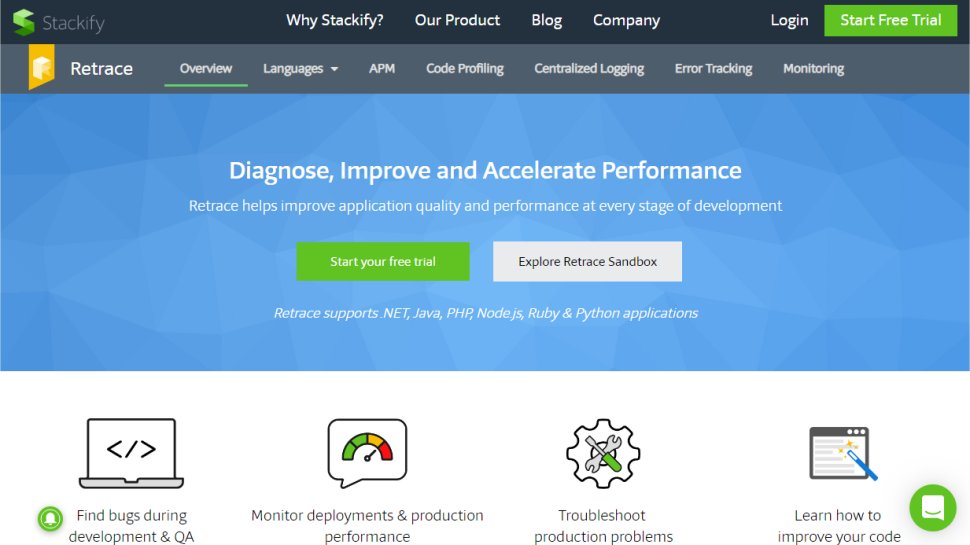
If you’re a developer or have a team of software engineers working within your company, then it’s obviously quite common to come across performance issues and other bugs. Stackify Retrace is a targeted ‘devAPM’ system, giving development professionals the tools they need to find and address problems effectively.
The platform alerts developers if any issues and bugs have been found, and it can be used to improve performance levels across test and production servers. Retrace has been designed so that it provides visibility, data and actionable insights into app performance and faults. When issues arise, alerts are sent to a choice of destinations, including via email, SMS, or Slack.
There’s a centralized dashboard that displays code performance and metrics, including errors and logs. Stackify can also be used with most common app stacks, and this is a highly scalable SaaS solution, so it’s easy to install and use. Pricing is $50 (£38) per month per server.
Applications Manager from ManageEngine is a tool which does exactly what it says on the tin. It’s being marketed as an enterprise-ready, usable and affordable APM. Businesses are provided with everything they need to ensure critical applications and systems are always in perfect working order.
This solution can find and address issues involving the end-user, applications and important components such as databases, servers, ERP packages, web services, cloud platforms, and virtual systems.
Applications Manager works with a single install and allows you to address issues easily, plus when looking further down the road, it’s highly scalable – indeed, it can scale to up to 50,000 applications. Pricing is not detailed on the website.

Other APM options to consider
There are a number of other vendors leading the way with APM solutions. Here we’ll provide a few more options for you to consider as part of your IT infrastructure management.
LogicMonitor offers automated hybrid infrastructure monitoring and analytics, which means it can automatically monitor all devices, or work with a preconfigured set of rules for the tools you use. LogicMonitor’s platform works with servers, cloud, VMs, storage, networks, and apps, as well as websites. In short, it offers a pretty comprehensive set of options for monitoring a wide range of necessary applications.
Dynatrace looks to simplify complexities in cloud management, not least with the automated monitoring of dynamic microservices. It makes it easy to visualize and monitor all services and provide alerts for events, not least unexpected access to files and information. As a platform, it really is very comprehensive in being able to identify problems and help staff rectify them, even when such issues have previously gone unnoticed or have been difficult to pin down.
New Relic APM monitoring uses clear visualization to help identify performance levels, bottlenecks, and dependencies, by offering a complete overview of your operating environment. Aside from automated processes, the charts are well-presented and make it very clear where root causes lie, making it easier to identify and fix problems. It also works with a lot of data, not just from the apps being monitored, but also key metrics from user agents to make identifying solutions to issues easier to adapt for customer needs.
Microsoft System Center aims to make it easier to deploy, configure, and manage the IT infrastructure that you’re monitoring. The interface is easy to use and reliable, but you may still find there’s something of a learning curve as it has a broad range of software features. However, once you get to grips with those, it can be very easy to configure your own custom system and deployments.


